Water quality in Hubli
Where 829 mg/L sits
Your area reads High. BIS rates water up to 500 mg/L as acceptable and 150–300 mg/L as ideal for taste and health.
What an RO purifier changes
Hubli tap today
~829mg/L
After RO purification
~41–83mg/L
An RO membrane typically removes 90–95% of dissolved solids, bringing water into the ideal drinking band. Boon purifiers remineralise after RO so the water isn’t stripped flat.
What this means for you in Hubli
Taste
Noticeably hard, with a flat or mineral taste.
Health
Above the BIS limit — purification is recommended for regular drinking.
Appliances
Promotes scaling (white deposits) on taps, geysers, kettles and RO membranes.
What to use
A reverse-osmosis (RO) purifier is the right fit here.
Other parameters that matter
| Parameter | BIS limit | Why it matters |
|---|---|---|
| Bacteriological (E. coli / coliform) | Nil in any 100 ml | Causes stomach infections; needs UV or boiling. |
| Fluoride | 1.0 mg/L (max 1.5) | Excess causes dental & skeletal fluorosis. |
| Arsenic | 0.01 mg/L | Toxic; long-term exposure is carcinogenic. |
| Nitrate | 45 mg/L | Risky for infants (blue-baby syndrome). |
| Iron | 0.3 mg/L | Metallic taste, staining of fixtures & clothes. |
| Total hardness | 200 mg/L (max 600) | Scaling on taps, geysers & appliances. |
Regional watch
Government groundwater surveys have flagged elevated fluoride, nitrate in parts of Karnataka. If you draw borewell water, get these tested specifically.
Microbiological note
Bacterial safety (E. coli/coliform) is not part of chemical groundwater monitoring, so it needs a lab test of your own tap, and varies with pipe leaks and monsoon. UV purification (built into Boon purifiers) inactivates bacteria and viruses; RO removes the dissolved contaminants above.
Why is TDS like this in Hubli?
Most Indian cities draw heavily on groundwater, which dissolves minerals and salts from the soil and rock it sits in. Over-extraction, ageing pipes and local geology push dissolved solids (TDS), hardness and sometimes fluoride, nitrate or arsenic above safe limits. City taps often blend treated municipal supply with borewell water, so two buildings on the same street can read very differently — and levels shift with the seasons, usually peaking just before the monsoon. The figure above is an indicative area reading from government monitoring, so your own tap can differ; testing it twice a year is a good habit.
Read our full guide to TDS & how to reduce it ›How Hubli compares
Among the cities we map, Hubli has the 25th highest average groundwater TDS — about 1.7× the BIS acceptable limit of 500 mg/L, against a median of 616 mg/L across those cities.
Individual monitoring points around Hubli range from 388 to 3806 mg/L. An average hides that spread, so your own borewell or municipal line can read well above or below 829 mg/L — one more reason to test your actual supply.
Elsewhere in Karnataka, Mysore averages ~610 mg/L, Bangalore ~520 mg/L, Belgaum ~515 mg/L and Mangalore ~70 mg/L.
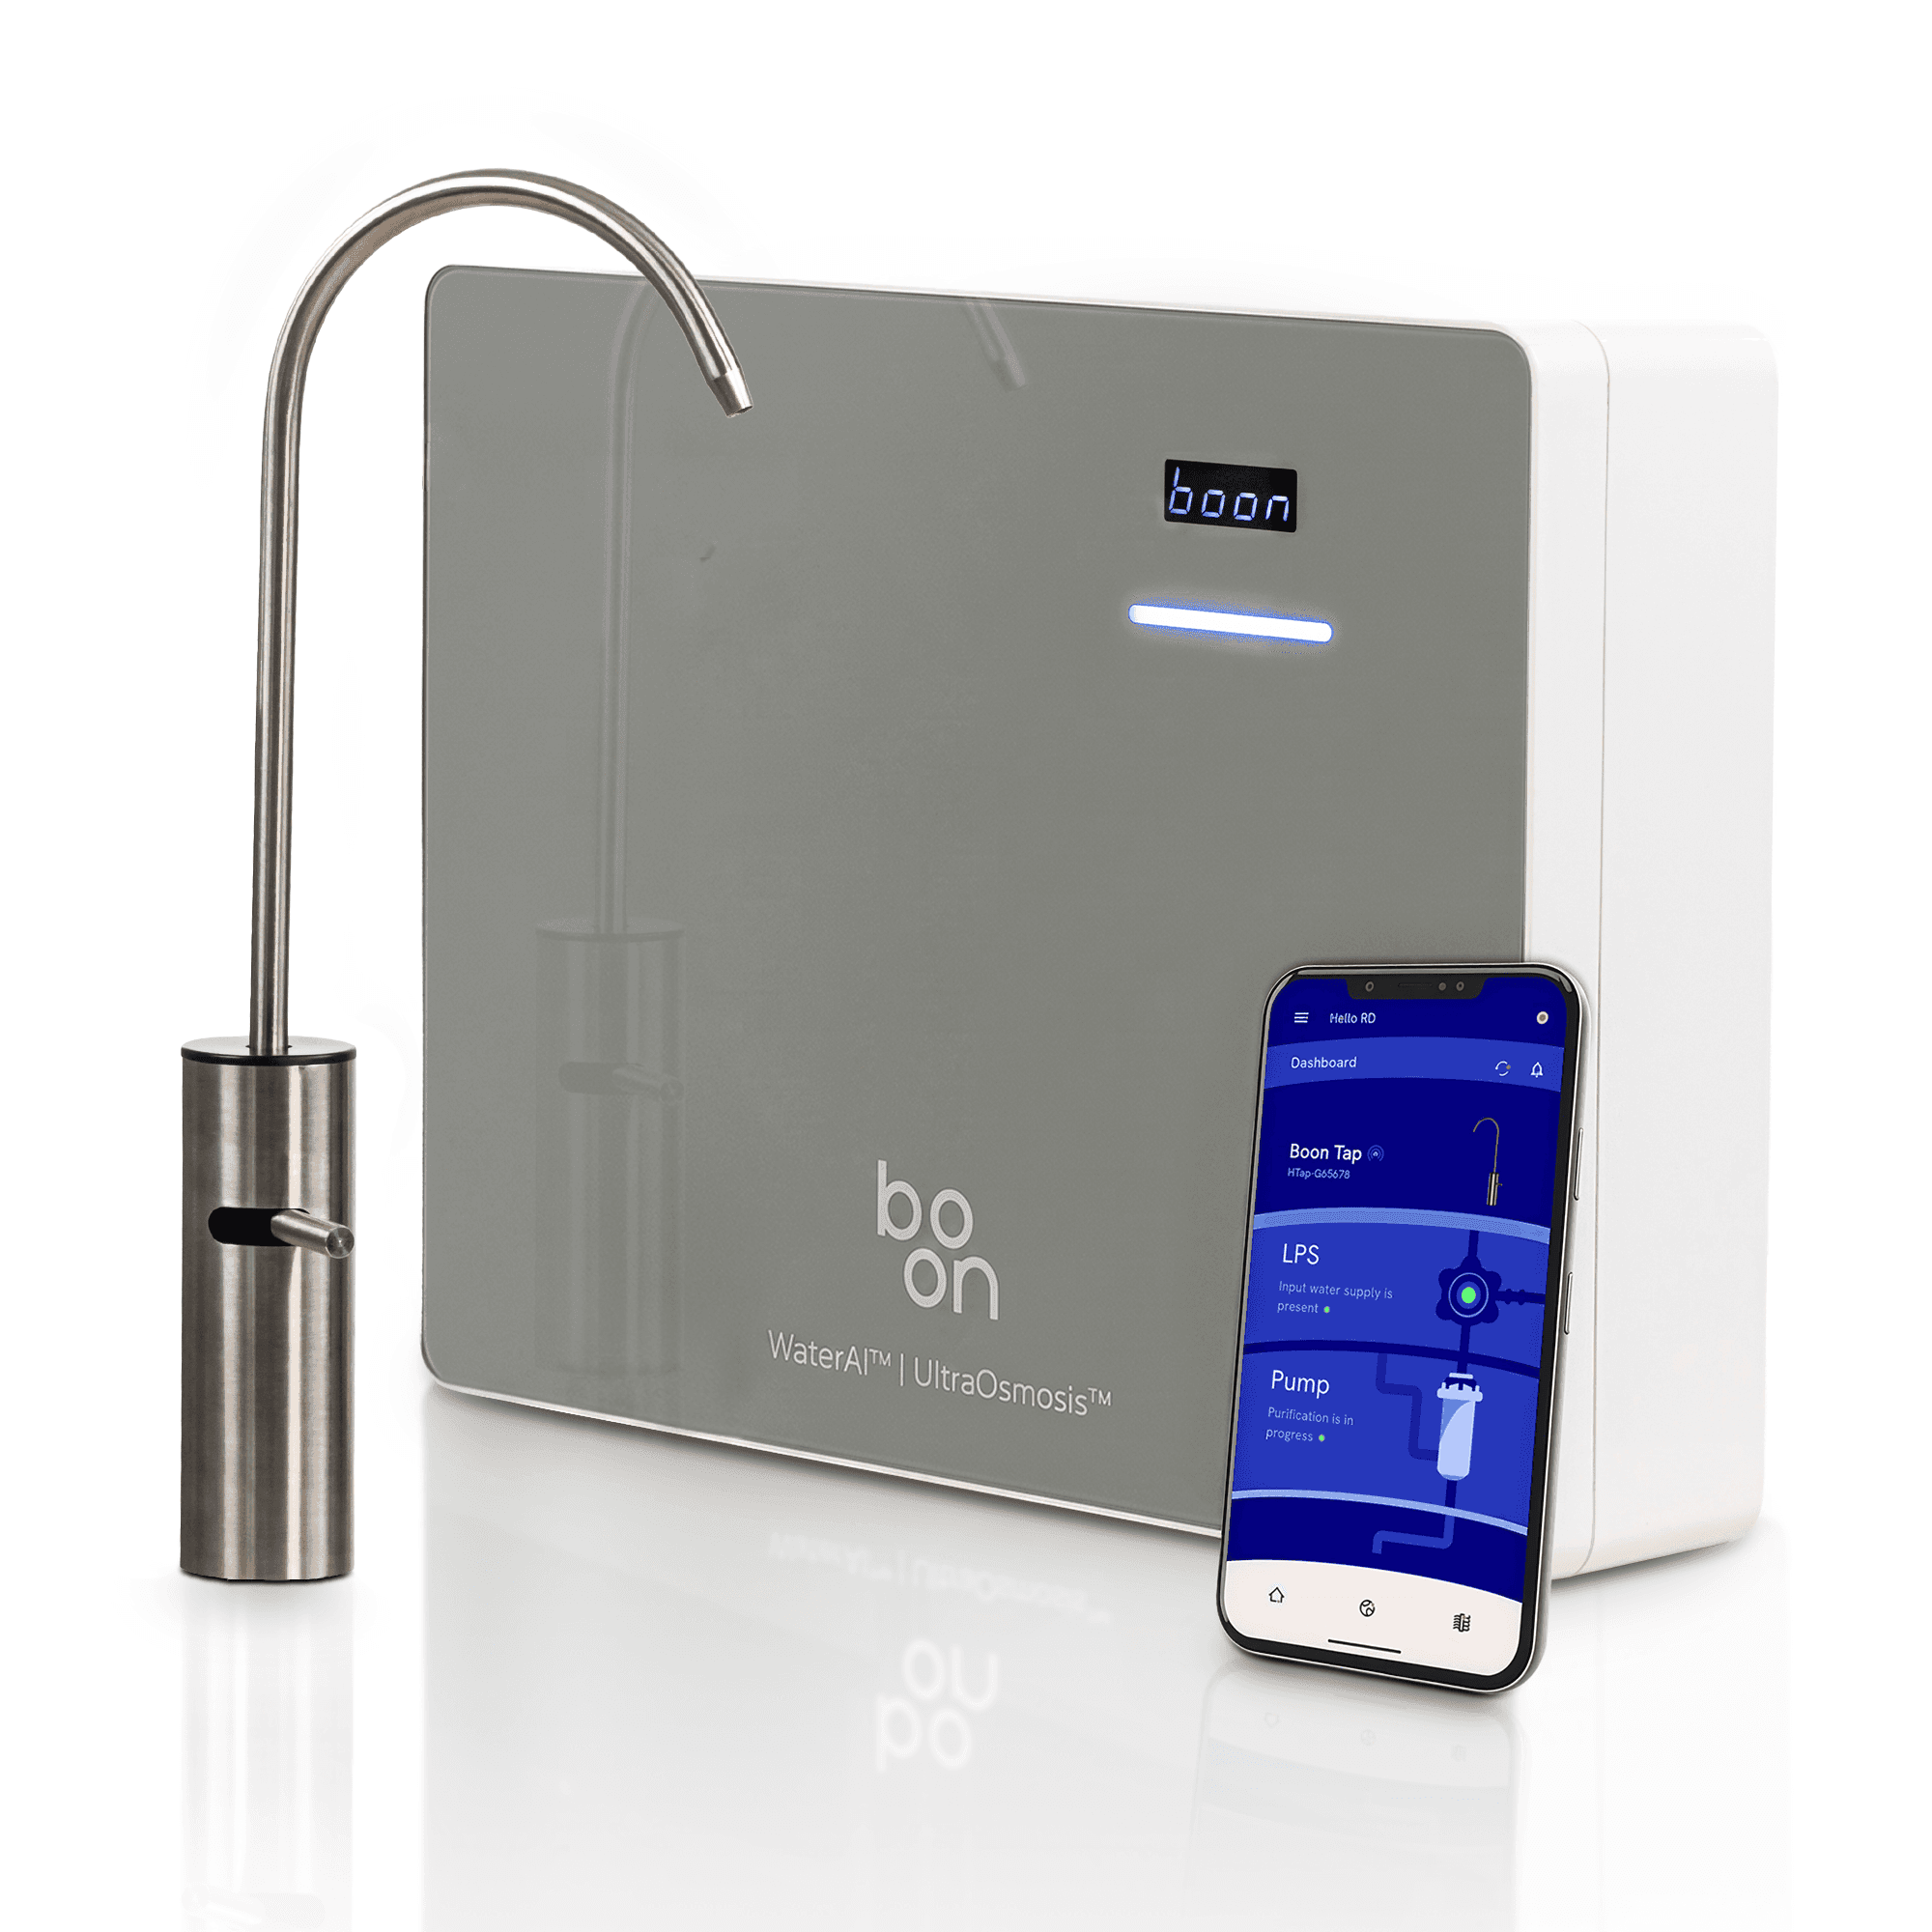
06 · Best fit for Hubli
Boon Tap
from ₹18,500
TDS here averages ~829 mg/L, above the BIS limit of 500, so a reverse-osmosis (RO) purifier like Boon Tap is recommended.
Hubli water — questions
What is the TDS of water in Hubli?
Groundwater near Hubli has an average TDS of about 829 mg/L, above the BIS acceptable limit of 500 mg/L, based on government monitoring data (CGWB station monitoring via India-WRIS National Water Data Portal (EC-derived TDS, 25 km radius), 2016–2022). Levels range roughly 388 to 3806 mg/L across nearby monitoring points.
Is tap water safe to drink in Hubli?
With TDS around 829 mg/L (above the BIS limit of 500), water in Hubli is generally not ideal for direct drinking, so an RO purifier is recommended. Always test your own supply.
Do I need an RO water purifier in Hubli?
Yes. High TDS or hardness in Hubli means reverse osmosis (RO) is the appropriate technology to bring water within safe, palatable limits.
Reports for other cities
Data sources
- CGWB station monitoring via India-WRIS National Water Data Portal (EC-derived TDS, 25 km radius)
- CGWB National Groundwater Quality 2018-2021 (EC-derived TDS)
- CGWB Annual Ground Water Quality Report 2024 (2023 monitoring)
- CGWB district groundwater brochures & state reports (2013-2024)
- CGWB Ground Water Quality (Manual - Chemical Parameters) via India-WRIS National Water Data Portal (station-level, 2015-2023)
- Pincode and locality coordinates: GeoNames postal codes, CC BY 4.0
Primary datasets: Central Ground Water Board (CGWB) and India-WRIS, Government of India; limits per BIS IS 10500.
Disclaimer: Figures are indicative area estimates from government groundwater monitoring nearest to this location and may differ from your exact tap or municipal supply. They are not a substitute for a lab test of your own water. This page is general information, not medical advice, and any product suggestion is general guidance based on typical area readings, not a diagnosis of your supply. For health concerns, consult a qualified professional.